JCR Operations & Strategy
I. Executive Overview
01. The Baseline
JCR is a multi-asset real estate company with a portfolio spanning residential and commercial properties. While managing their existing tenants, in-house staff, and outside client portfolios, they decided to turn their attention to the short-term rental market with an initial pilot program. Three specific properties were selected, prepped, and set up; however, they soon found themselves with more operational strain and lower profits than what was initially expected.
That’s where I came in. I was brought in to create a profitable, sustainable, and scalable operation. JCR required:
- Create automated business processes from the ground up with guardrails and safety nets.
- Optimize the pricing structure and create financial strategies to increase overall profits.
- Provide consolidated and transparent operational and financial reports.
02. The Engine
Process & Pipelines
Centralized fragmented JCR data by building automated API workflows and a PostgreSQL database.
Price Analysis
Developed custom yield-scenario models within our BI suite to optimize booking lead times and recapture revenue previously lost to cancellations.
Process Improvement
Deployed webhook-triggered SMS dispatch and digital turnover reports to eliminate manual oversight and missed cleans.
Data Analytics
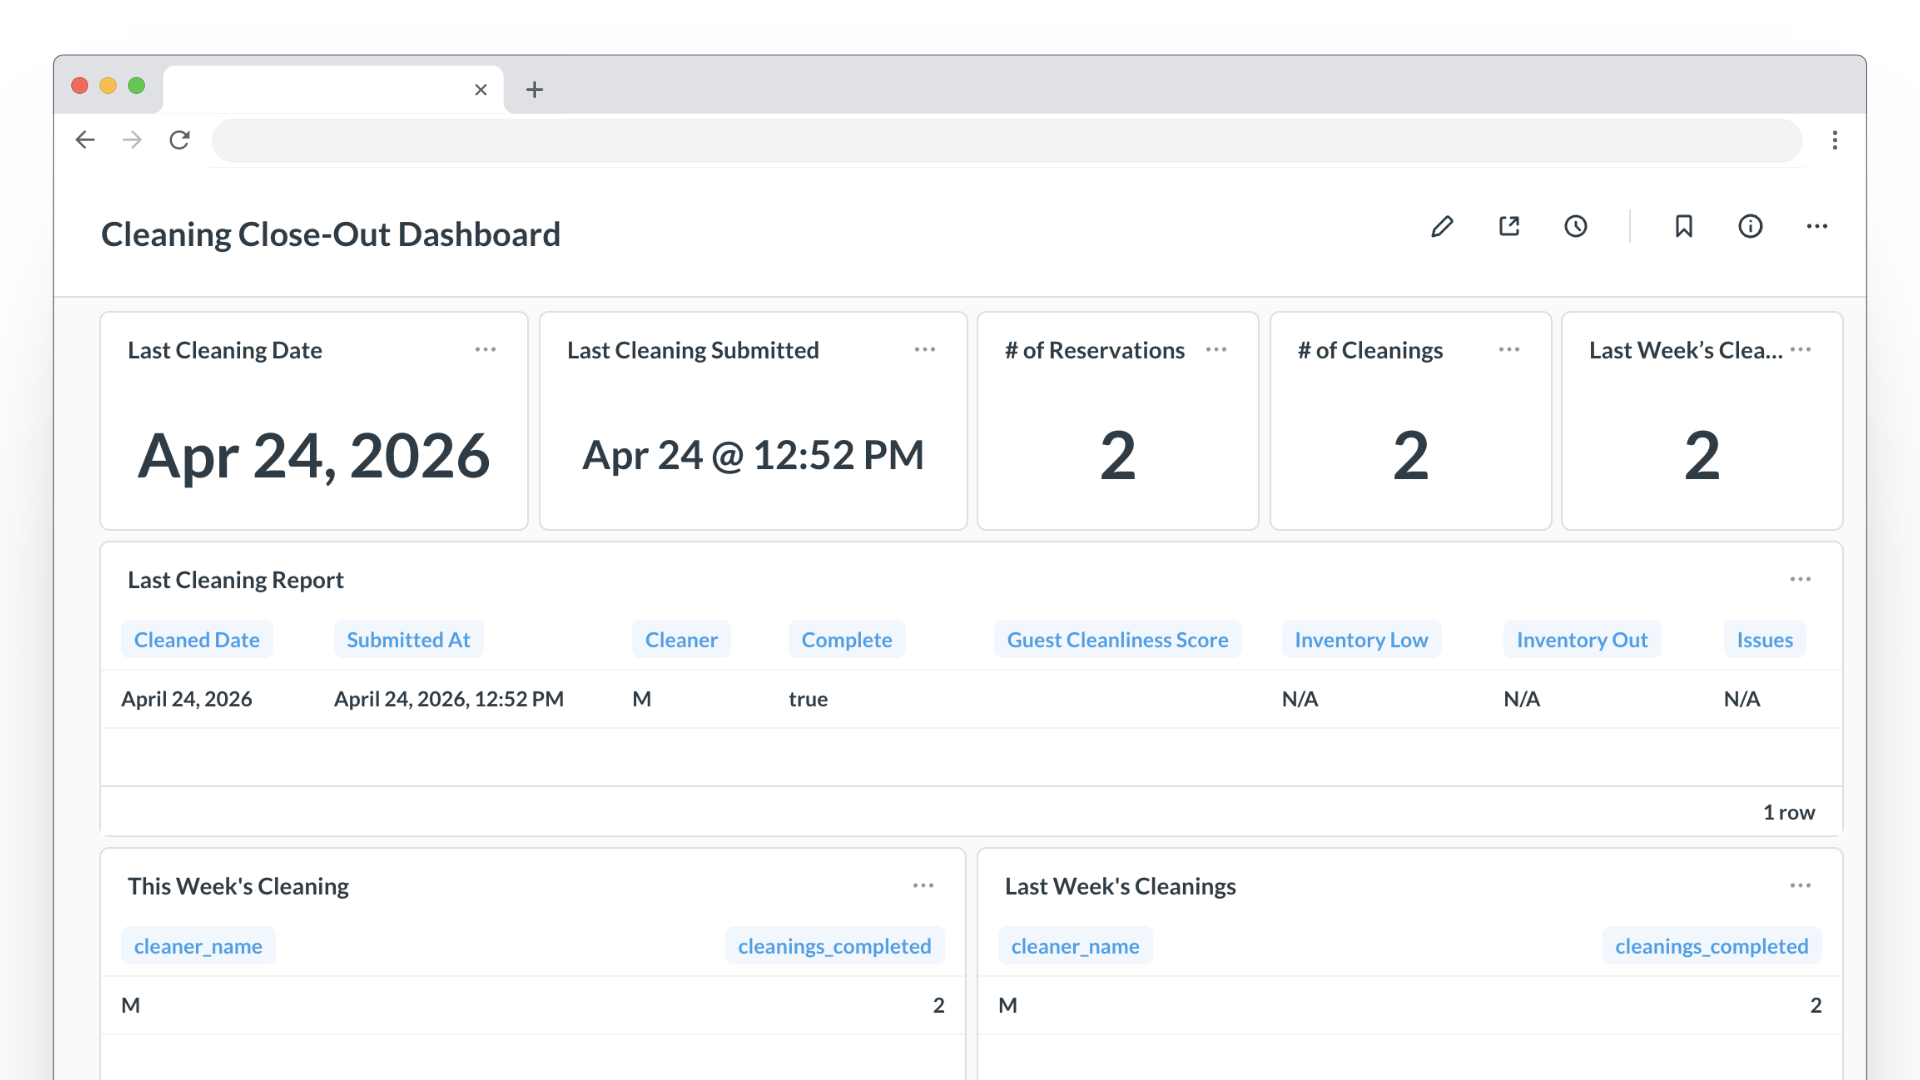
Established Metabase BI dashboards for real-time tracking of hospitality and financial analytics without manual data entry.
03. The Impact
"By dynamically restructuring our pricing parameters and automating ground dispatch, we successfully plugged critical revenue leaks and stabilized operations. To measure our performance, I tracked our Revenue Generation Index (RGI) to establish a clean 1-to-1 comparison, proving that our strategy drove an estimated 15% market-normalized yield lift, while maintaining a 4.95+ guest rating and top-tier search visibility."
II. Strategy & Operations
Problem & Scope
Short-term rentals run closer to the hospitality industry rather than the company’s traditional real estate business. I believe this was ultimately the friction JCR faced. In the hospitality industry, there are constant ground operations, such as coordinating cleaning and repair staff. There is an emphasis on customer satisfaction, and there are intricate strategies regarding dynamic pricing structures.
- Double Bookings & Errors: Issues included turnover events being double-booked and a last-minute booking resulting in a missed turnover, negatively impacting reviews.
- Low GOPPAR: Usage of suboptimal native platform pricing resulted in low Gross Operating Profit per Available Room.
- Strategic Blindspots: Leadership was flying blind, unable to speak on hospitality metrics or identify KPIs like Lead Time, LOS, or inventory decisions.
With over eight years in technical business operational roles, I utilized a standard operational process to understand the landscape, gather requirements, and create a project plan. I mapped the needs of two distinct user groups: the stakeholders and the ground team. The executive stakeholders needed consolidated financial reporting to view metrics like net profit and ADR without logging into multiple platforms, while the ground staff needed simple, automated schedules without the friction of learning a new software tool.
Yield Optimization
I routed the operational data through our new workflows and built dynamic forecasting models in Metabase. By analyzing historical booking data through these models, I was able to uncover a number of leaks in our pricing structure across the board. To ensure we were measuring true performance and not just seasonal swings, I structured our reporting to track our Revenue Generation Index (RGI) against the broader market.
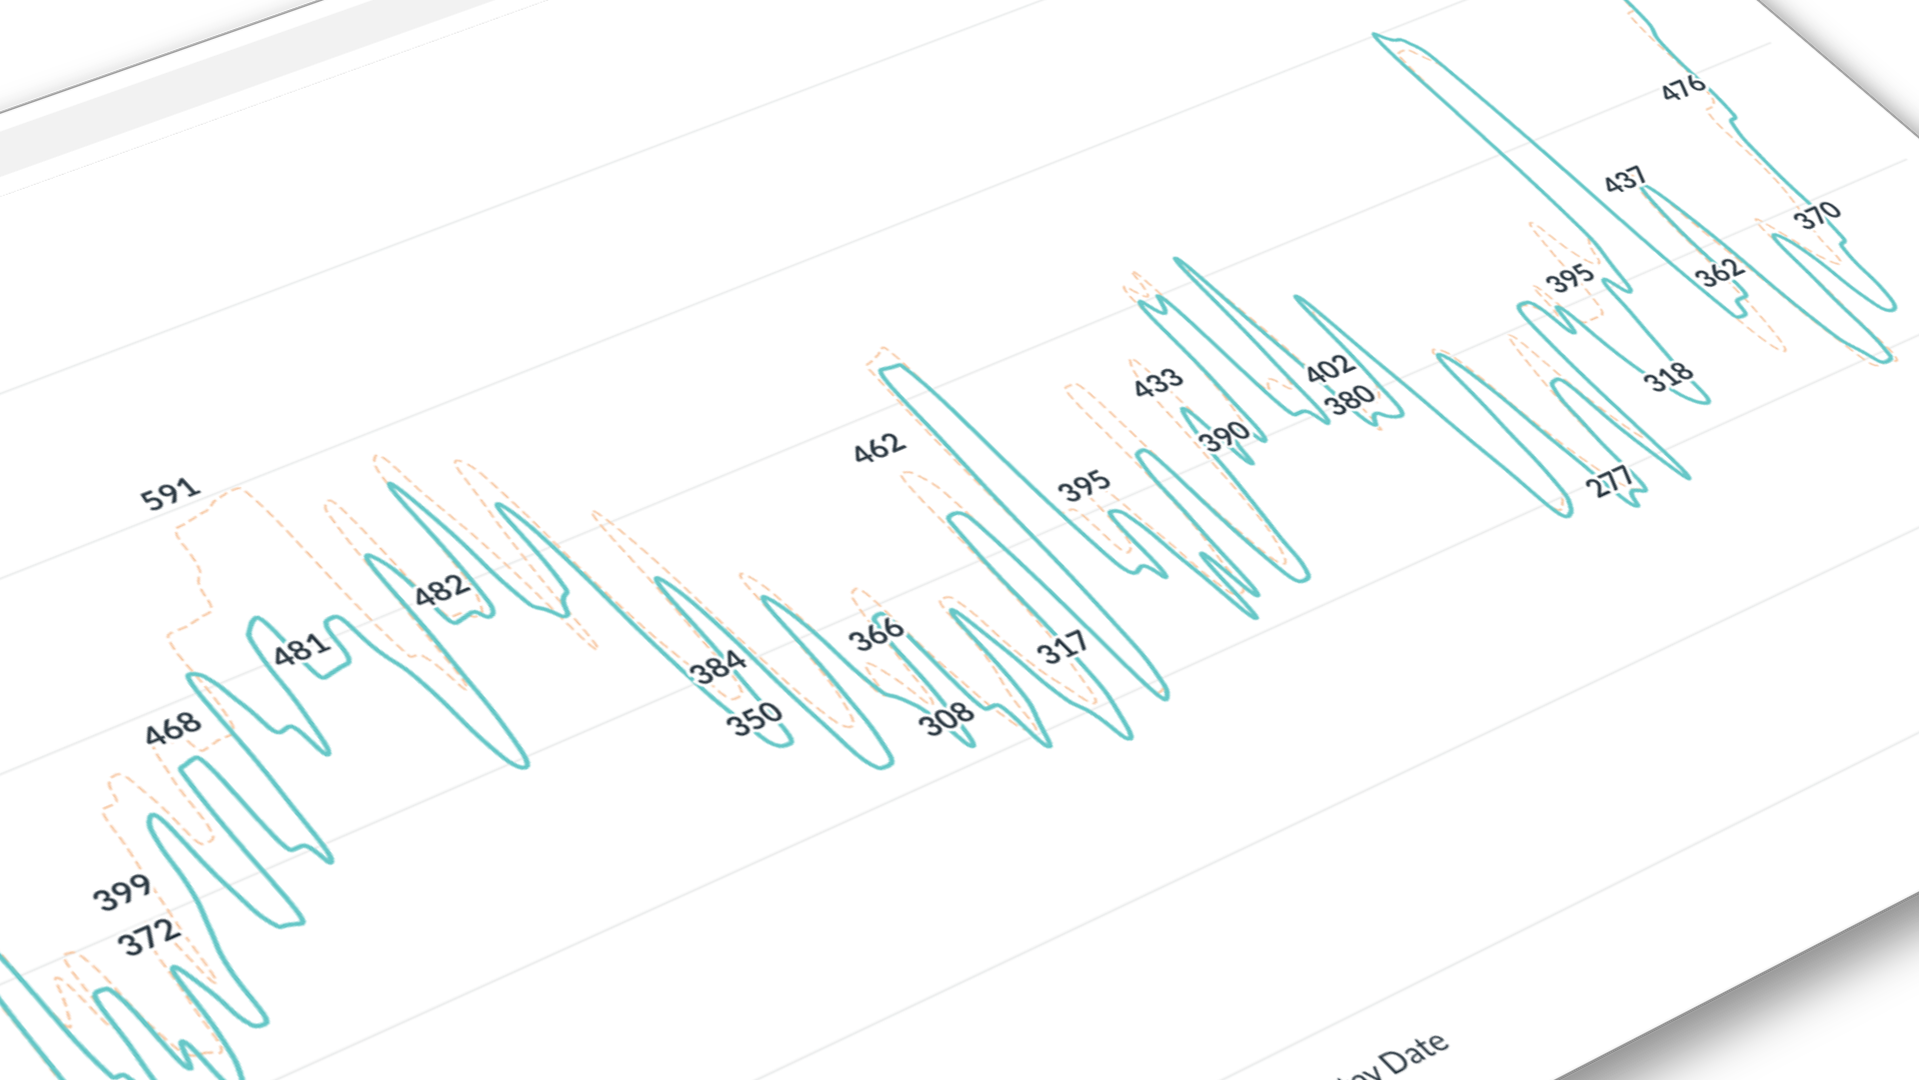
More than half (56%) of our bookings occurred within a week of check-in, with more than a third (34%) booked just three days out. While we expect last-minute stays in this location, our pricing curve was too steep in the middle, creating uncompetitive pricing eight or more days out. I optimized the pricing to target the 8-15 day booking window by flattening the pricing curve in the middle and reserving the price drop-off for only the last couple of days. This created a more competitive structure for the 8-15 day window while preserving our edge for last-minute bookers.
Increasing the average LOS helps book up low-demand days and lessens orphan days, which we previously had to heavily discount. While our baseline rule required a two to three-night minimum stay to protect the calendar, I built dynamic rules to bypass this specifically for last-minute booking windows. This allowed us to capture high-intent short stays without sacrificing far-out availability. By actively managing these calendar gaps, we increased one-day fill-in stays by about 10%.
To drive longer, more profitable bookings, I completely restructured our fee architecture. Instead of baking cleaning costs into the nightly rate, I decoupled them as a separate, fixed line item. This created a built-in mathematical incentive for guests: because the fixed cleaning cost amortizes over the duration of the trip, the total "per-night" cost becomes significantly cheaper for guests booking four or more days. This fee restructuring successfully incentivized extended stays while lowering our overall turnover costs.
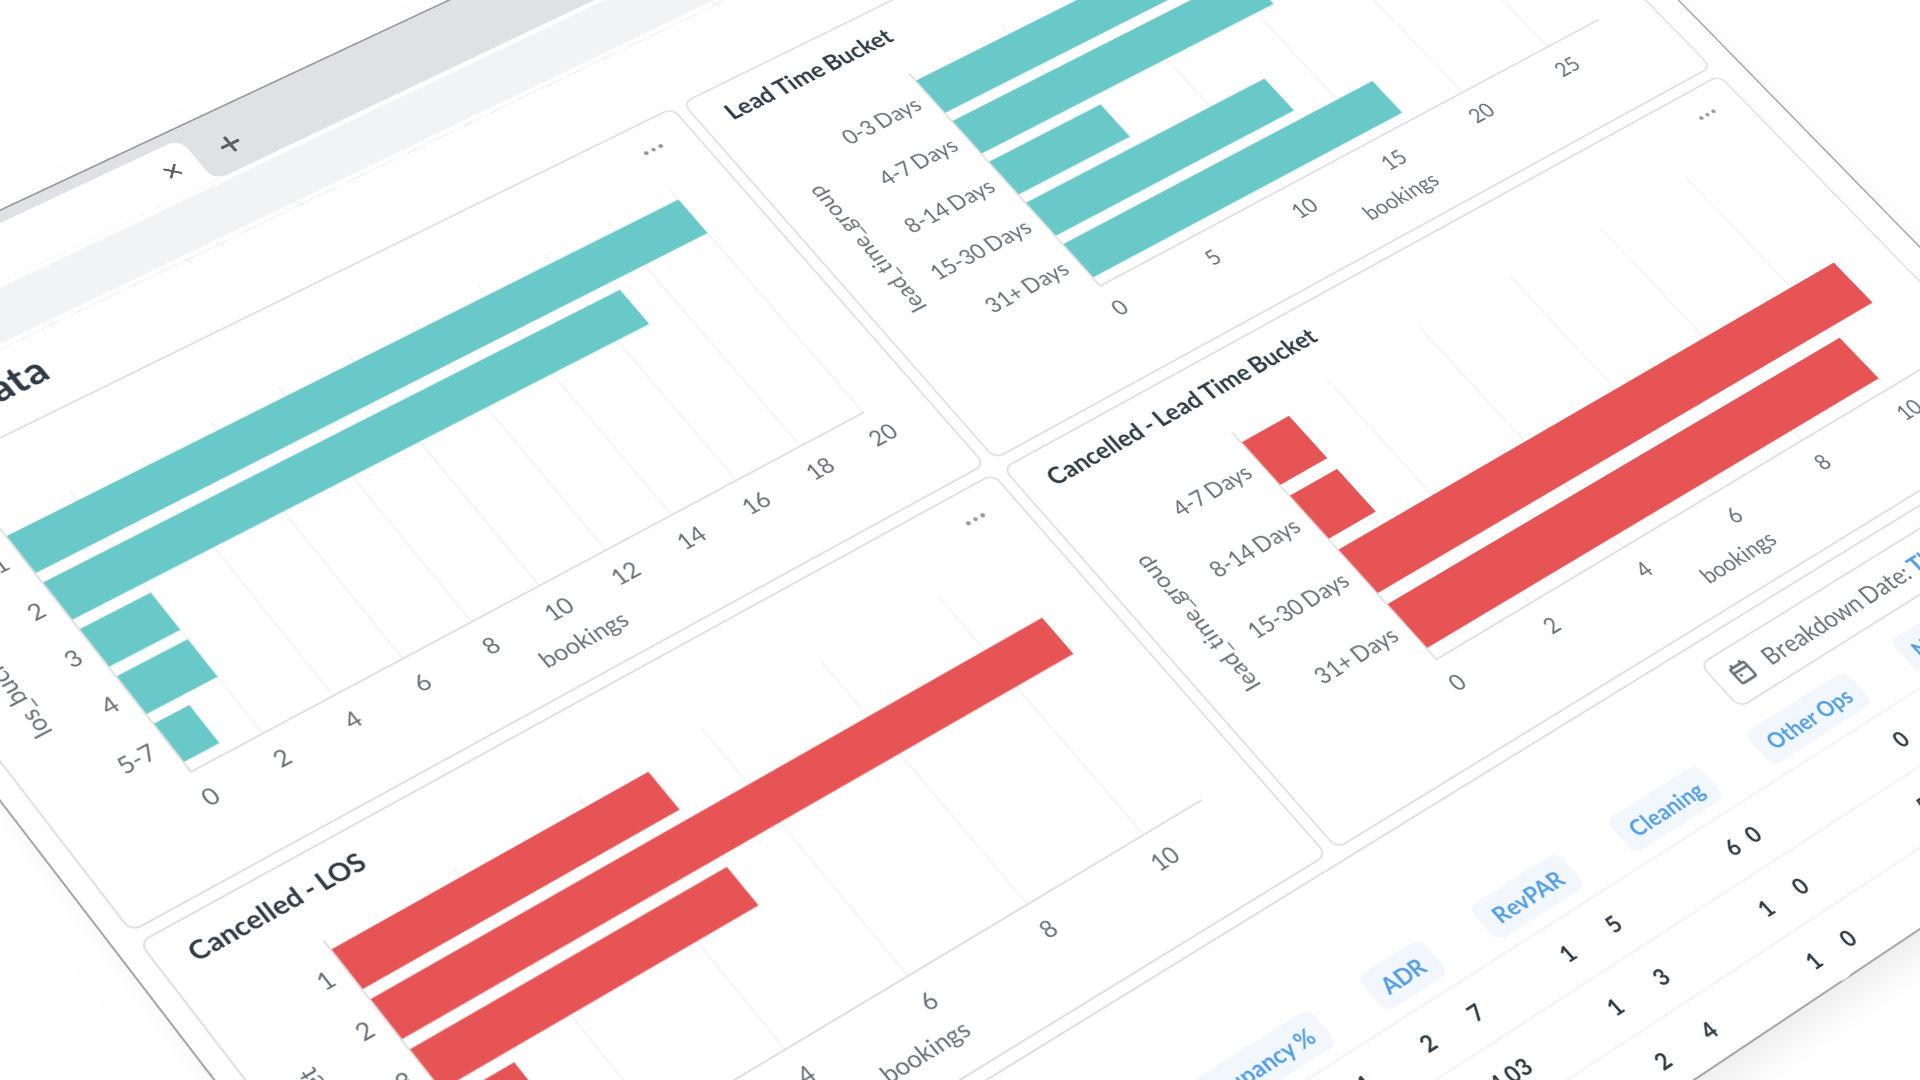
70% of all bookings made more than two weeks out resulted in cancellations. Our medium to far-out pricing was competitive at the time of booking, but as the date approached, guests would jump to cheaper listings. After modeling different scenarios, I made the strategic choice to lower our far-out prices to secure committed bookings. This significantly lowered our cancellation rate by more than 60%.
Because each listing had different target demographics and bedroom counts, I made individual adjustments. For example, our one-bedroom listing had a higher turnover to profit cost, so I optimized for longer stays. Our three-bedroom listing was in a prime location with high occupancy, so I optimized for premium rates on high-demand days.
Operational Automation
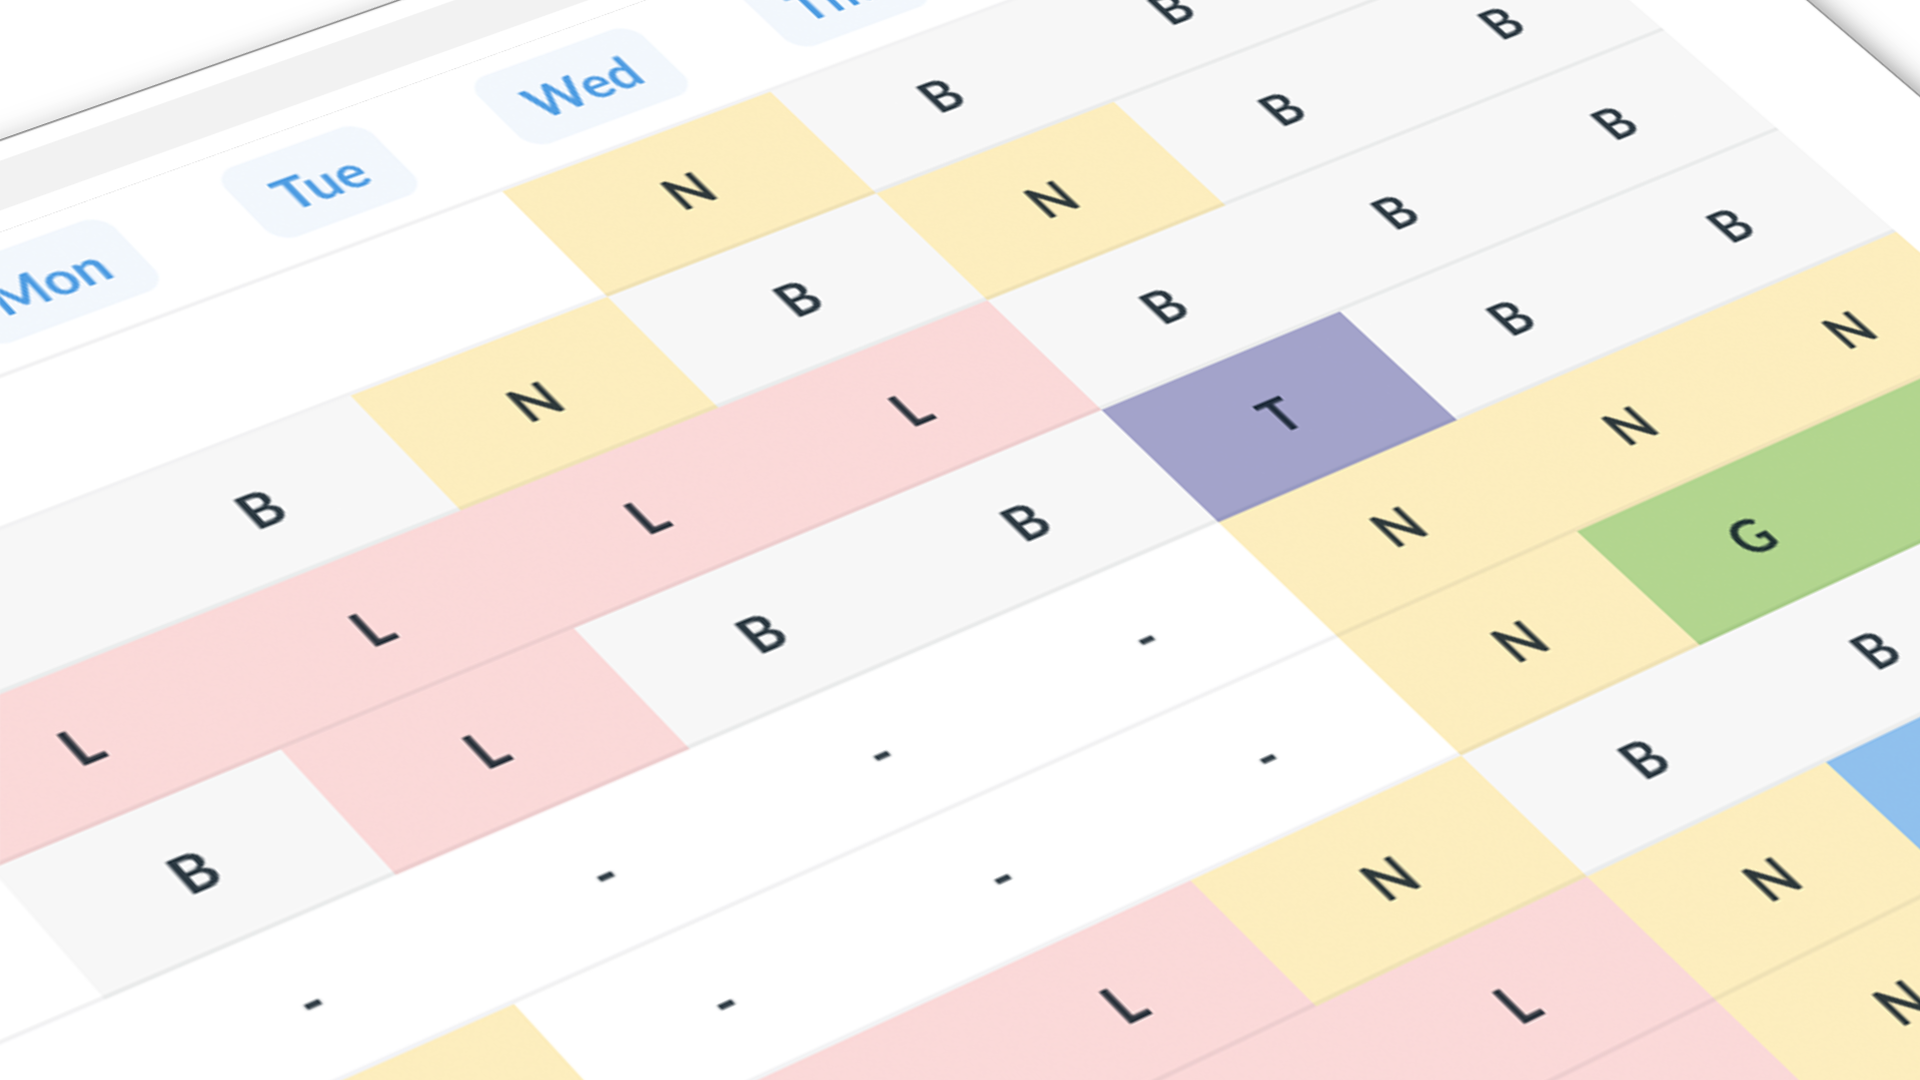
Revenue optimization is only half the equation, and fulfilling the operations is the other. The ground team was an operational liability because of the manual communication loop. Because they did not have access to our calendar, and we did not use a centralized operations management system for strategic reasons, there was no transparent product for the ground team to use. The tracking mechanism was difficult to maintain, misaligned schedules occurred, and communication was slow and inefficient. If a guest booked last-minute, staff relied on manual data entry based on the booking date, which lacked a reliable way to track statuses or alert cleaners.
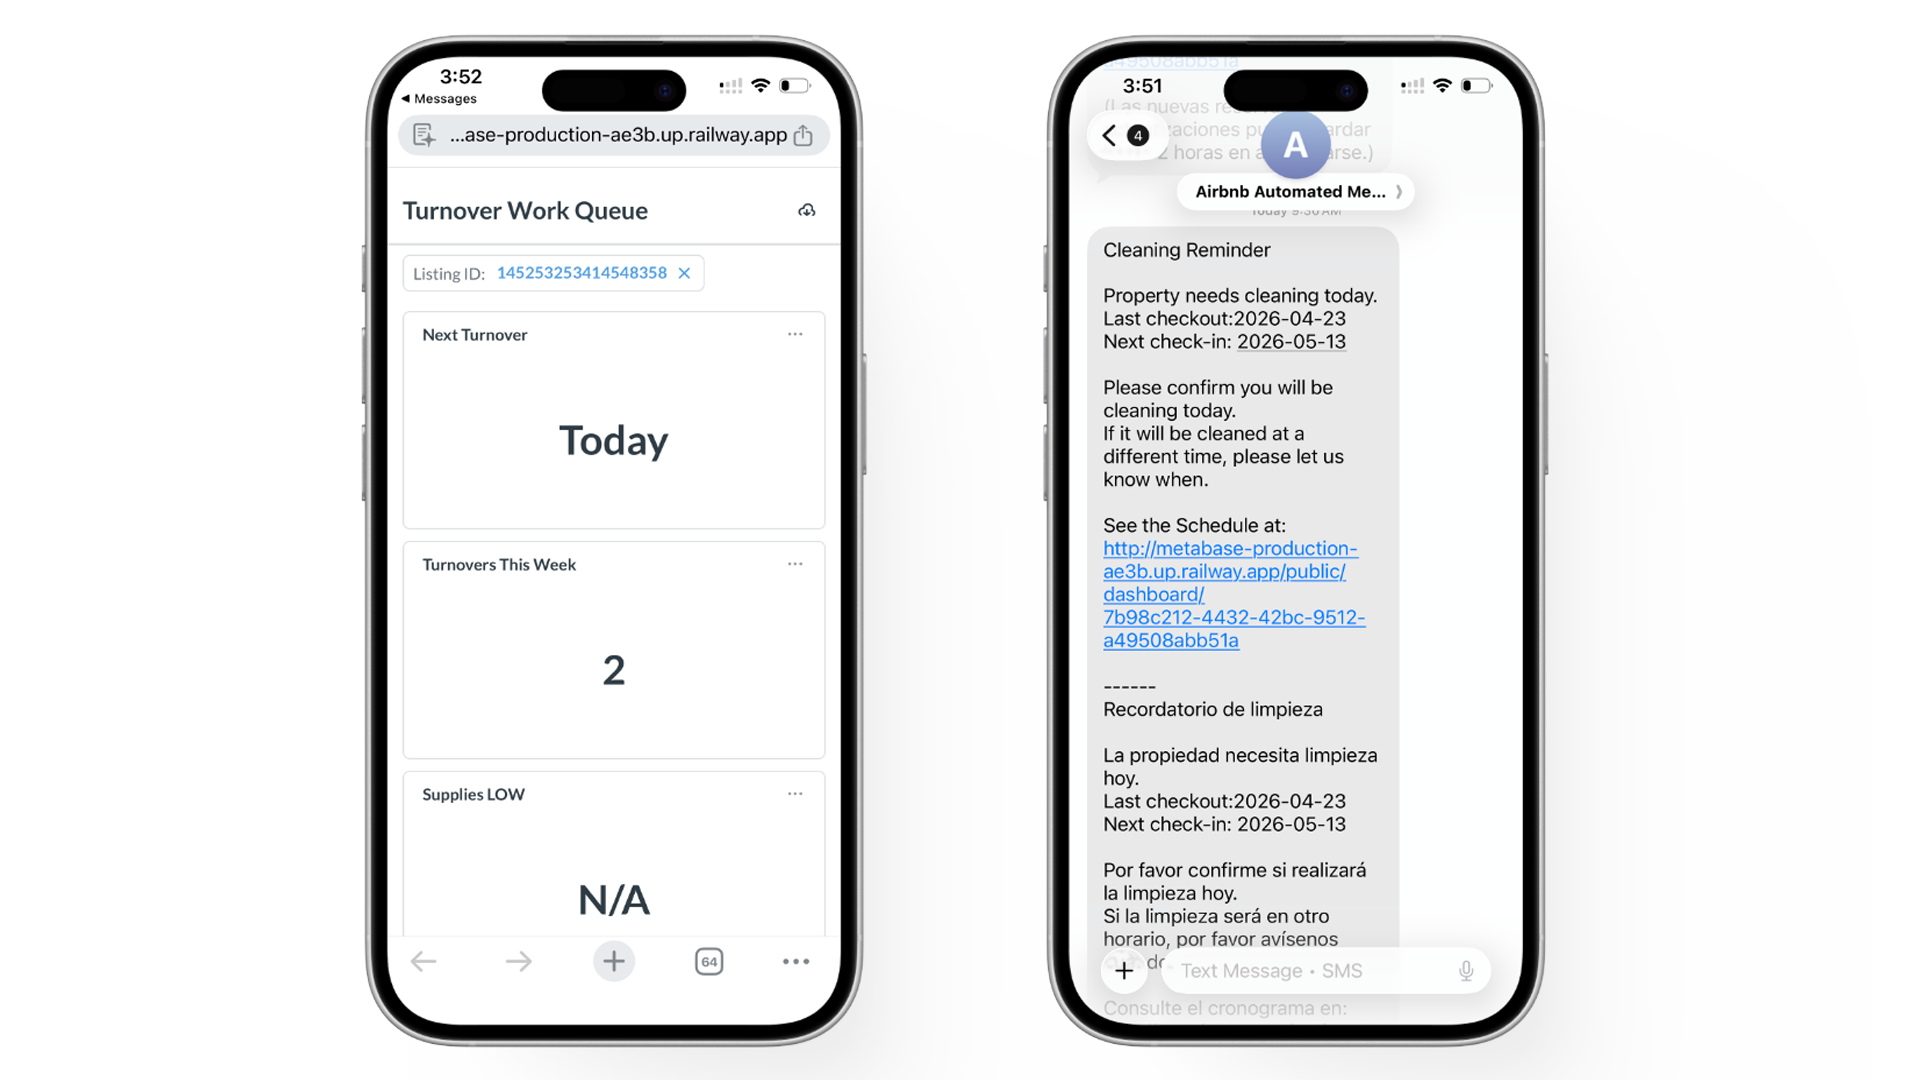
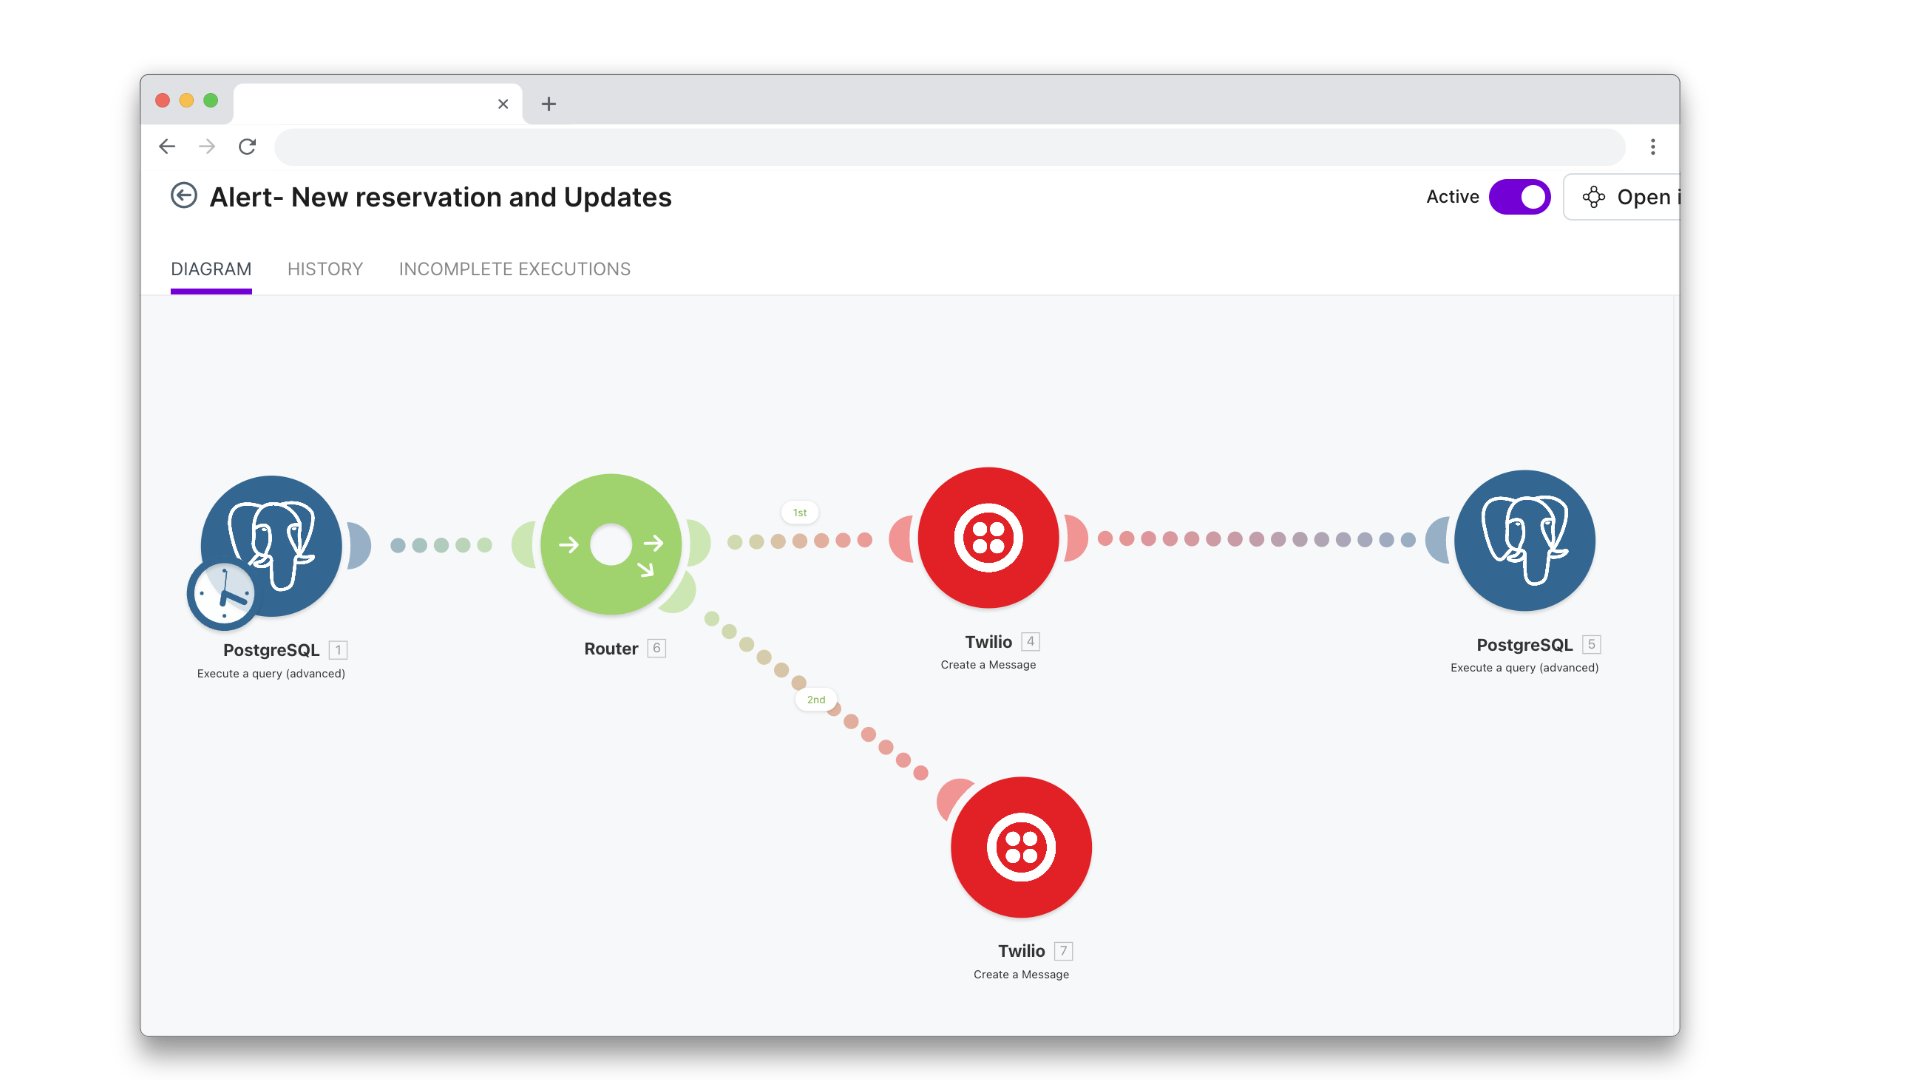
I removed the human element from the dispatch process. By setting up an active webhook workflow, real-time calendar payloads now trigger the ground operations. The system automatically sends an SMS dispatch notification to the assigned staff with specific door codes and checkout times. Automated and AI leveraged reminders, issues, and inventory requirements were tracked and automatically sent to the required party. This resulted in a 0% missed-clean rate and removed the need for manual oversight.
III. Operational Infrastructure
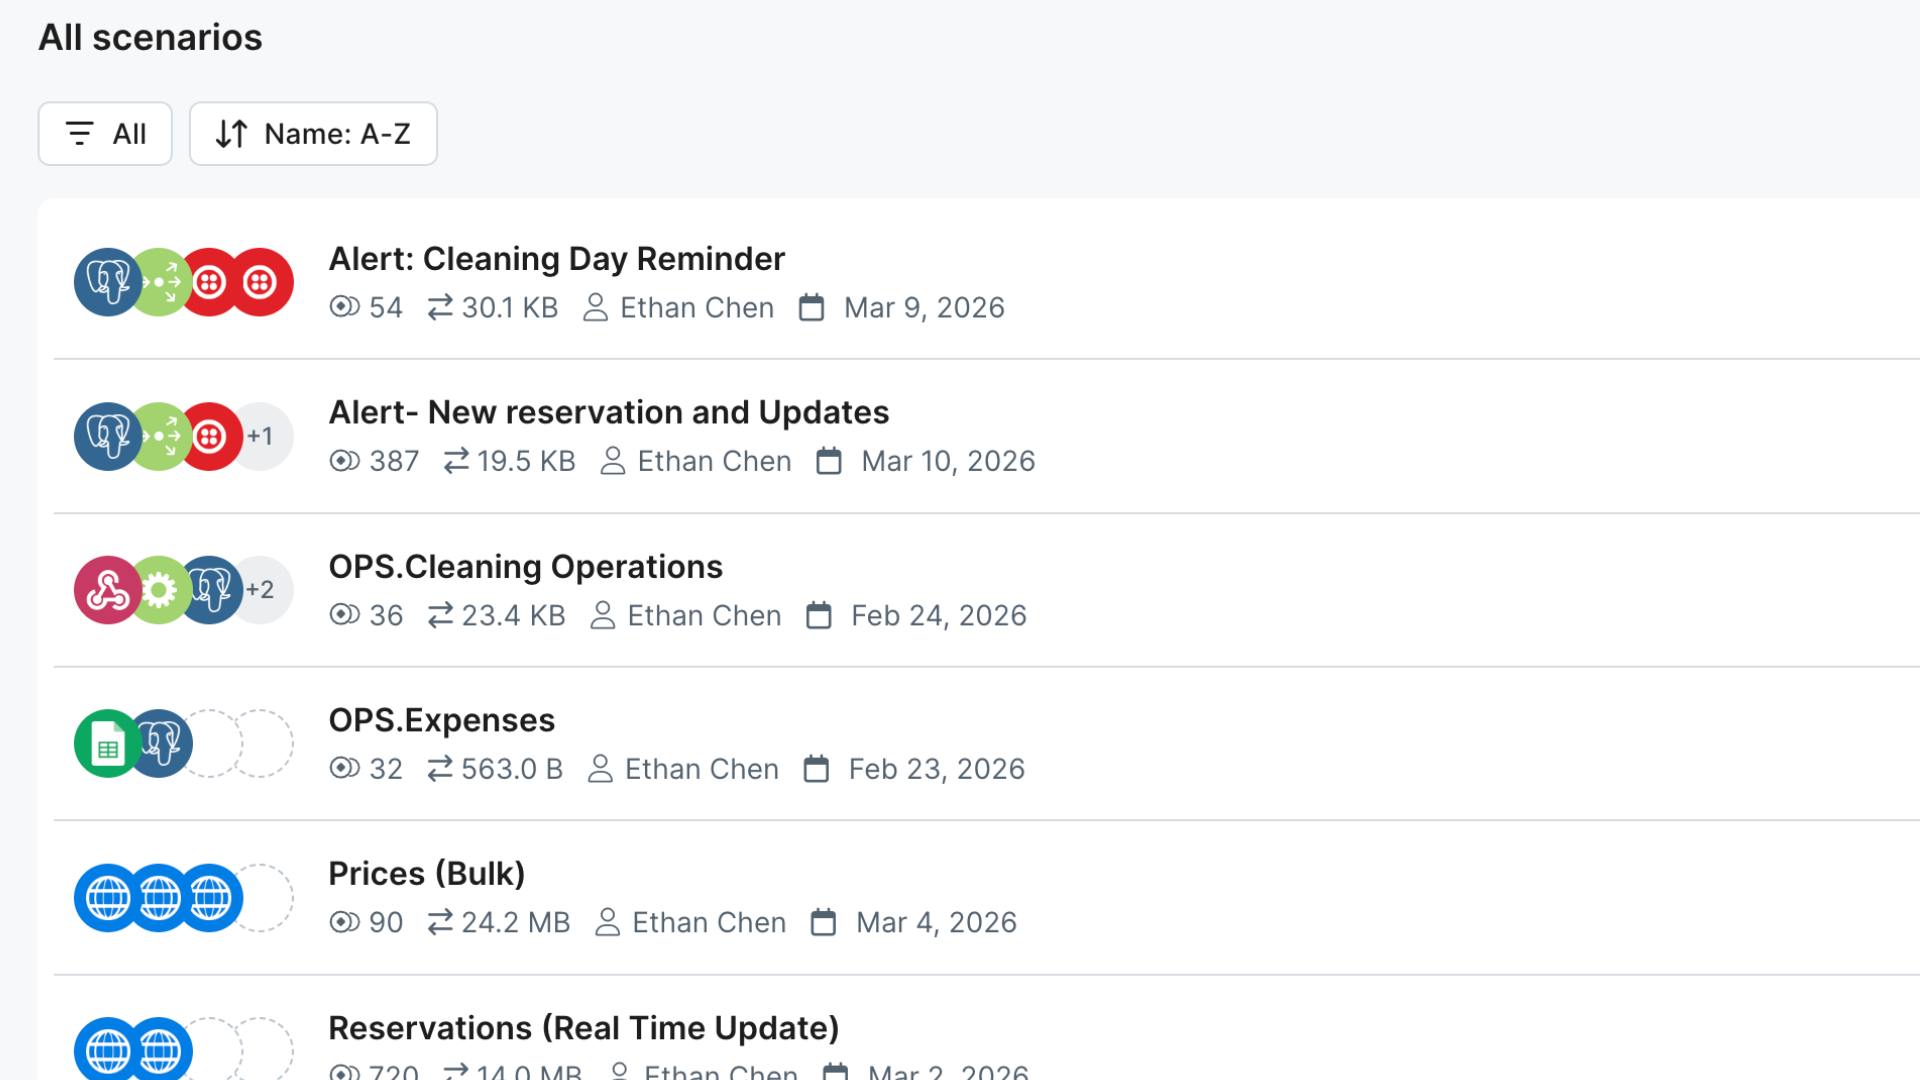
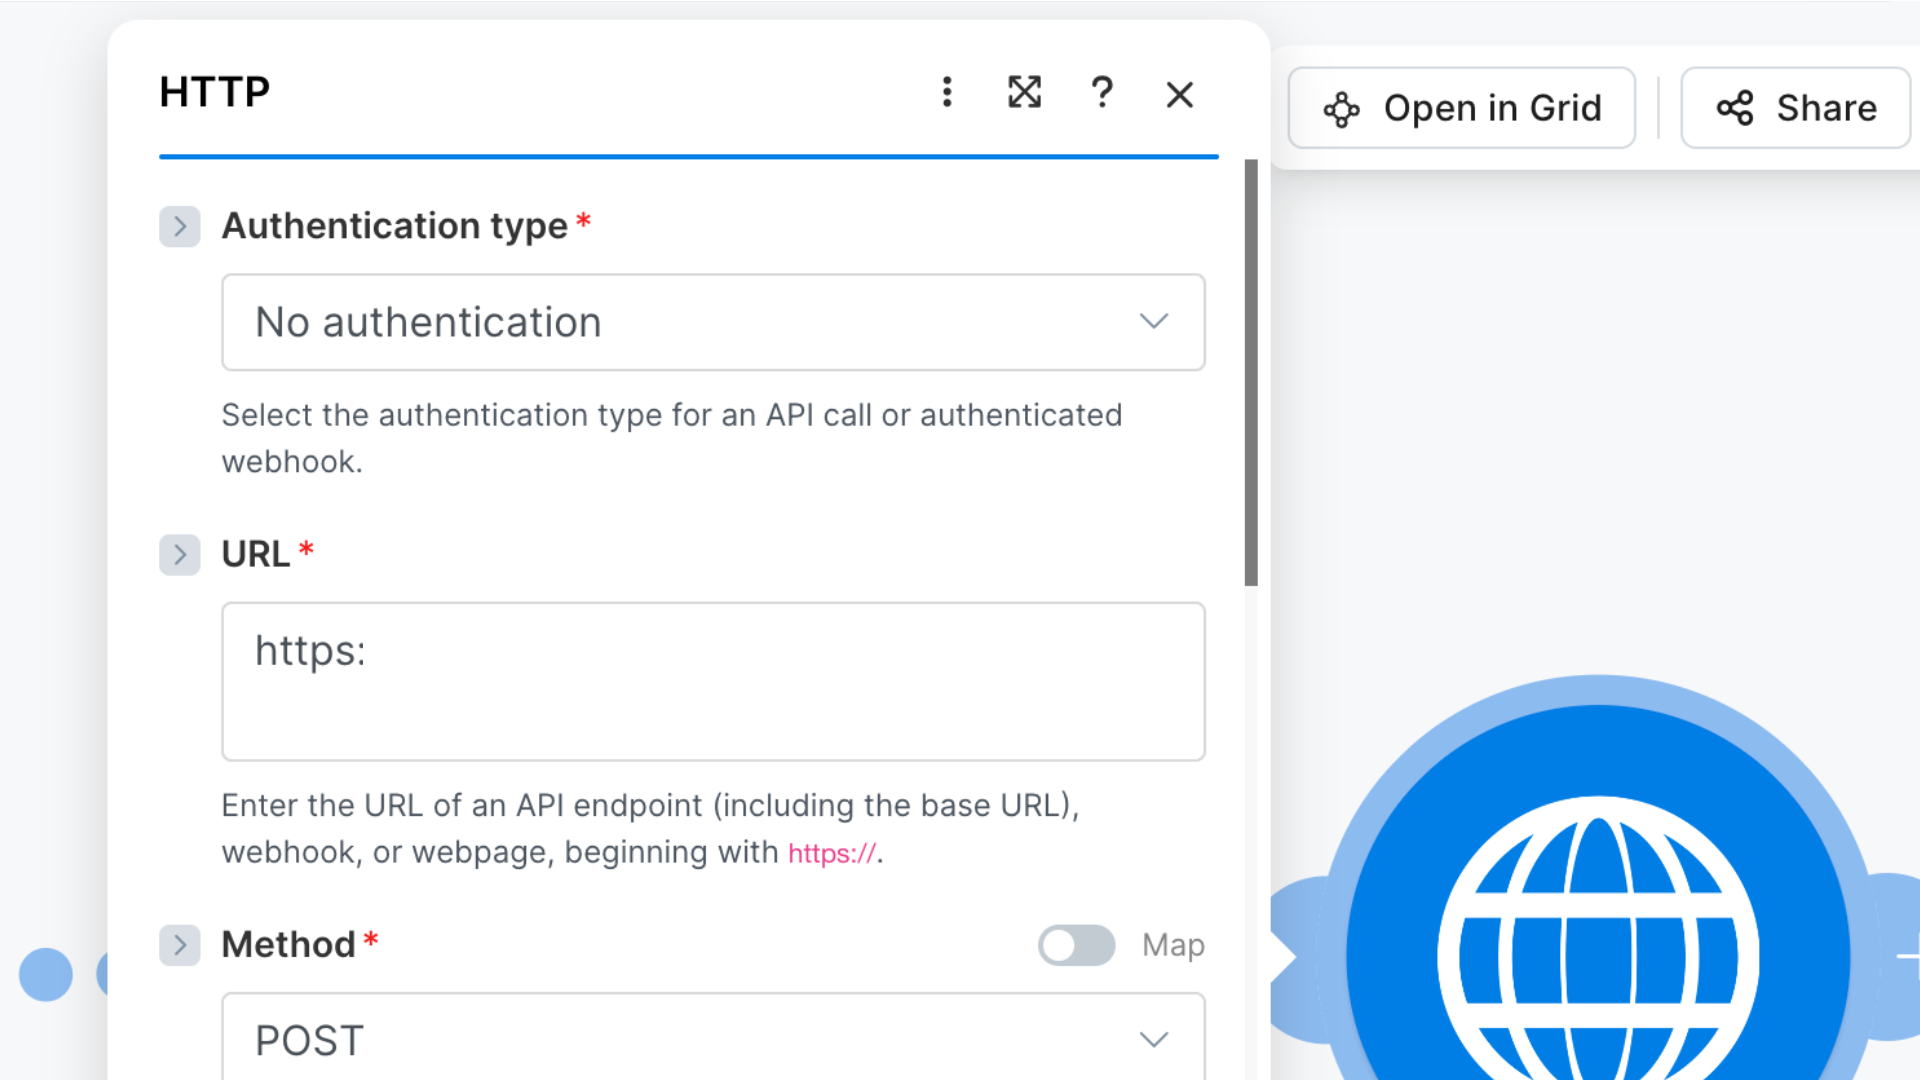
01. Automated API Workflows: I needed a way to pull operational and market data automatically. I utilized Make.com to catch webhook payloads, format the JSON, and route it directly into the backend. I also built logic gates to flag timeout issues before they affect the database.
IV. Next Steps
01. Business Scaling
The pilot program successfully demonstrated that automated workflows and custom yield logic generate higher margins than traditional real estate models. The next step involves evaluating how to expand these operational systems. We are in discussions to apply similar data centralization and reporting structures across their broader commercial and long-term residential portfolios. This will also include more front end support to long term residential tenants and outside clients.
02. The Retrospective
Ultimately, the project was successful and exciting. I built a system that allowed the client to actually see their business clearly for the first time. However, it didn't come without issues. For example when building a daily spine to join reservation records with daily prices, duplicate records were created that I had to patch. I also encountered difficult A/B price testing and reliable competitor data, which required me to re-evaluate and reiterate to get to an accurate portrayal. However, with each roadblock, I was able to assess the issue and determine the impact, which ultimately created a stronger and more robust system.